
THE SYSTEM MAPS
WAYFINDING MAPS for METRO
THE NEIGHBORHOOD MAPS
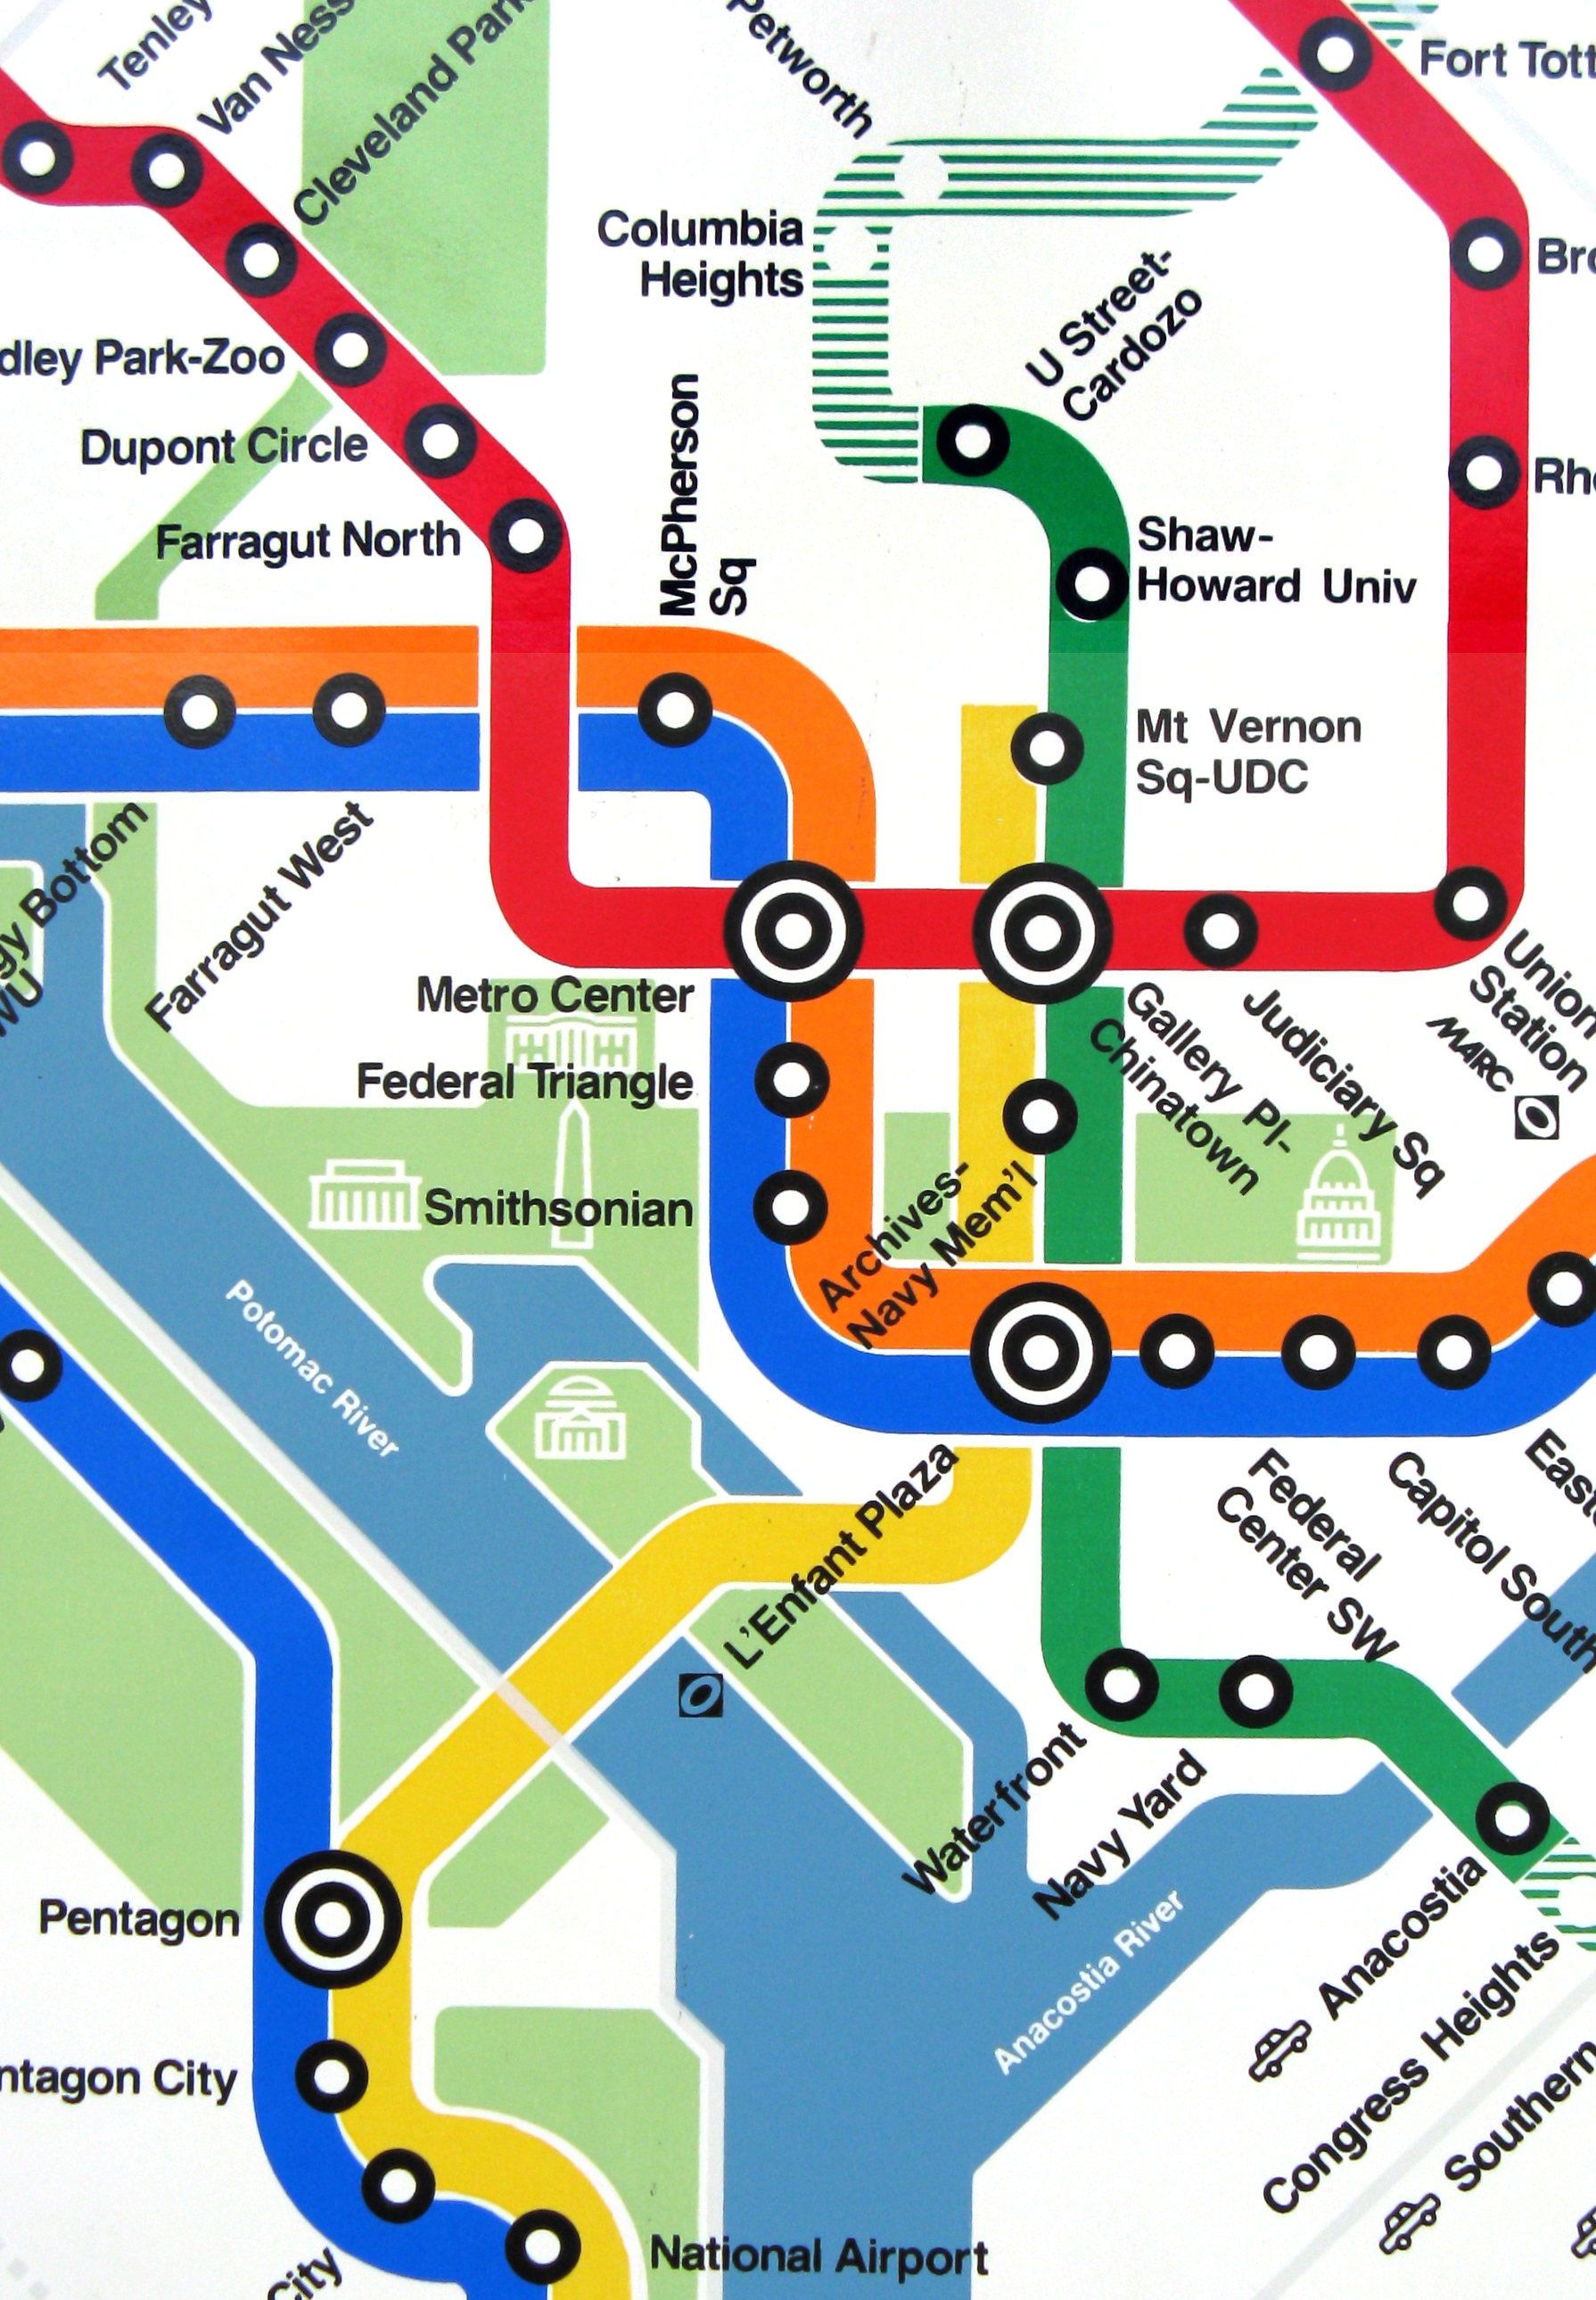
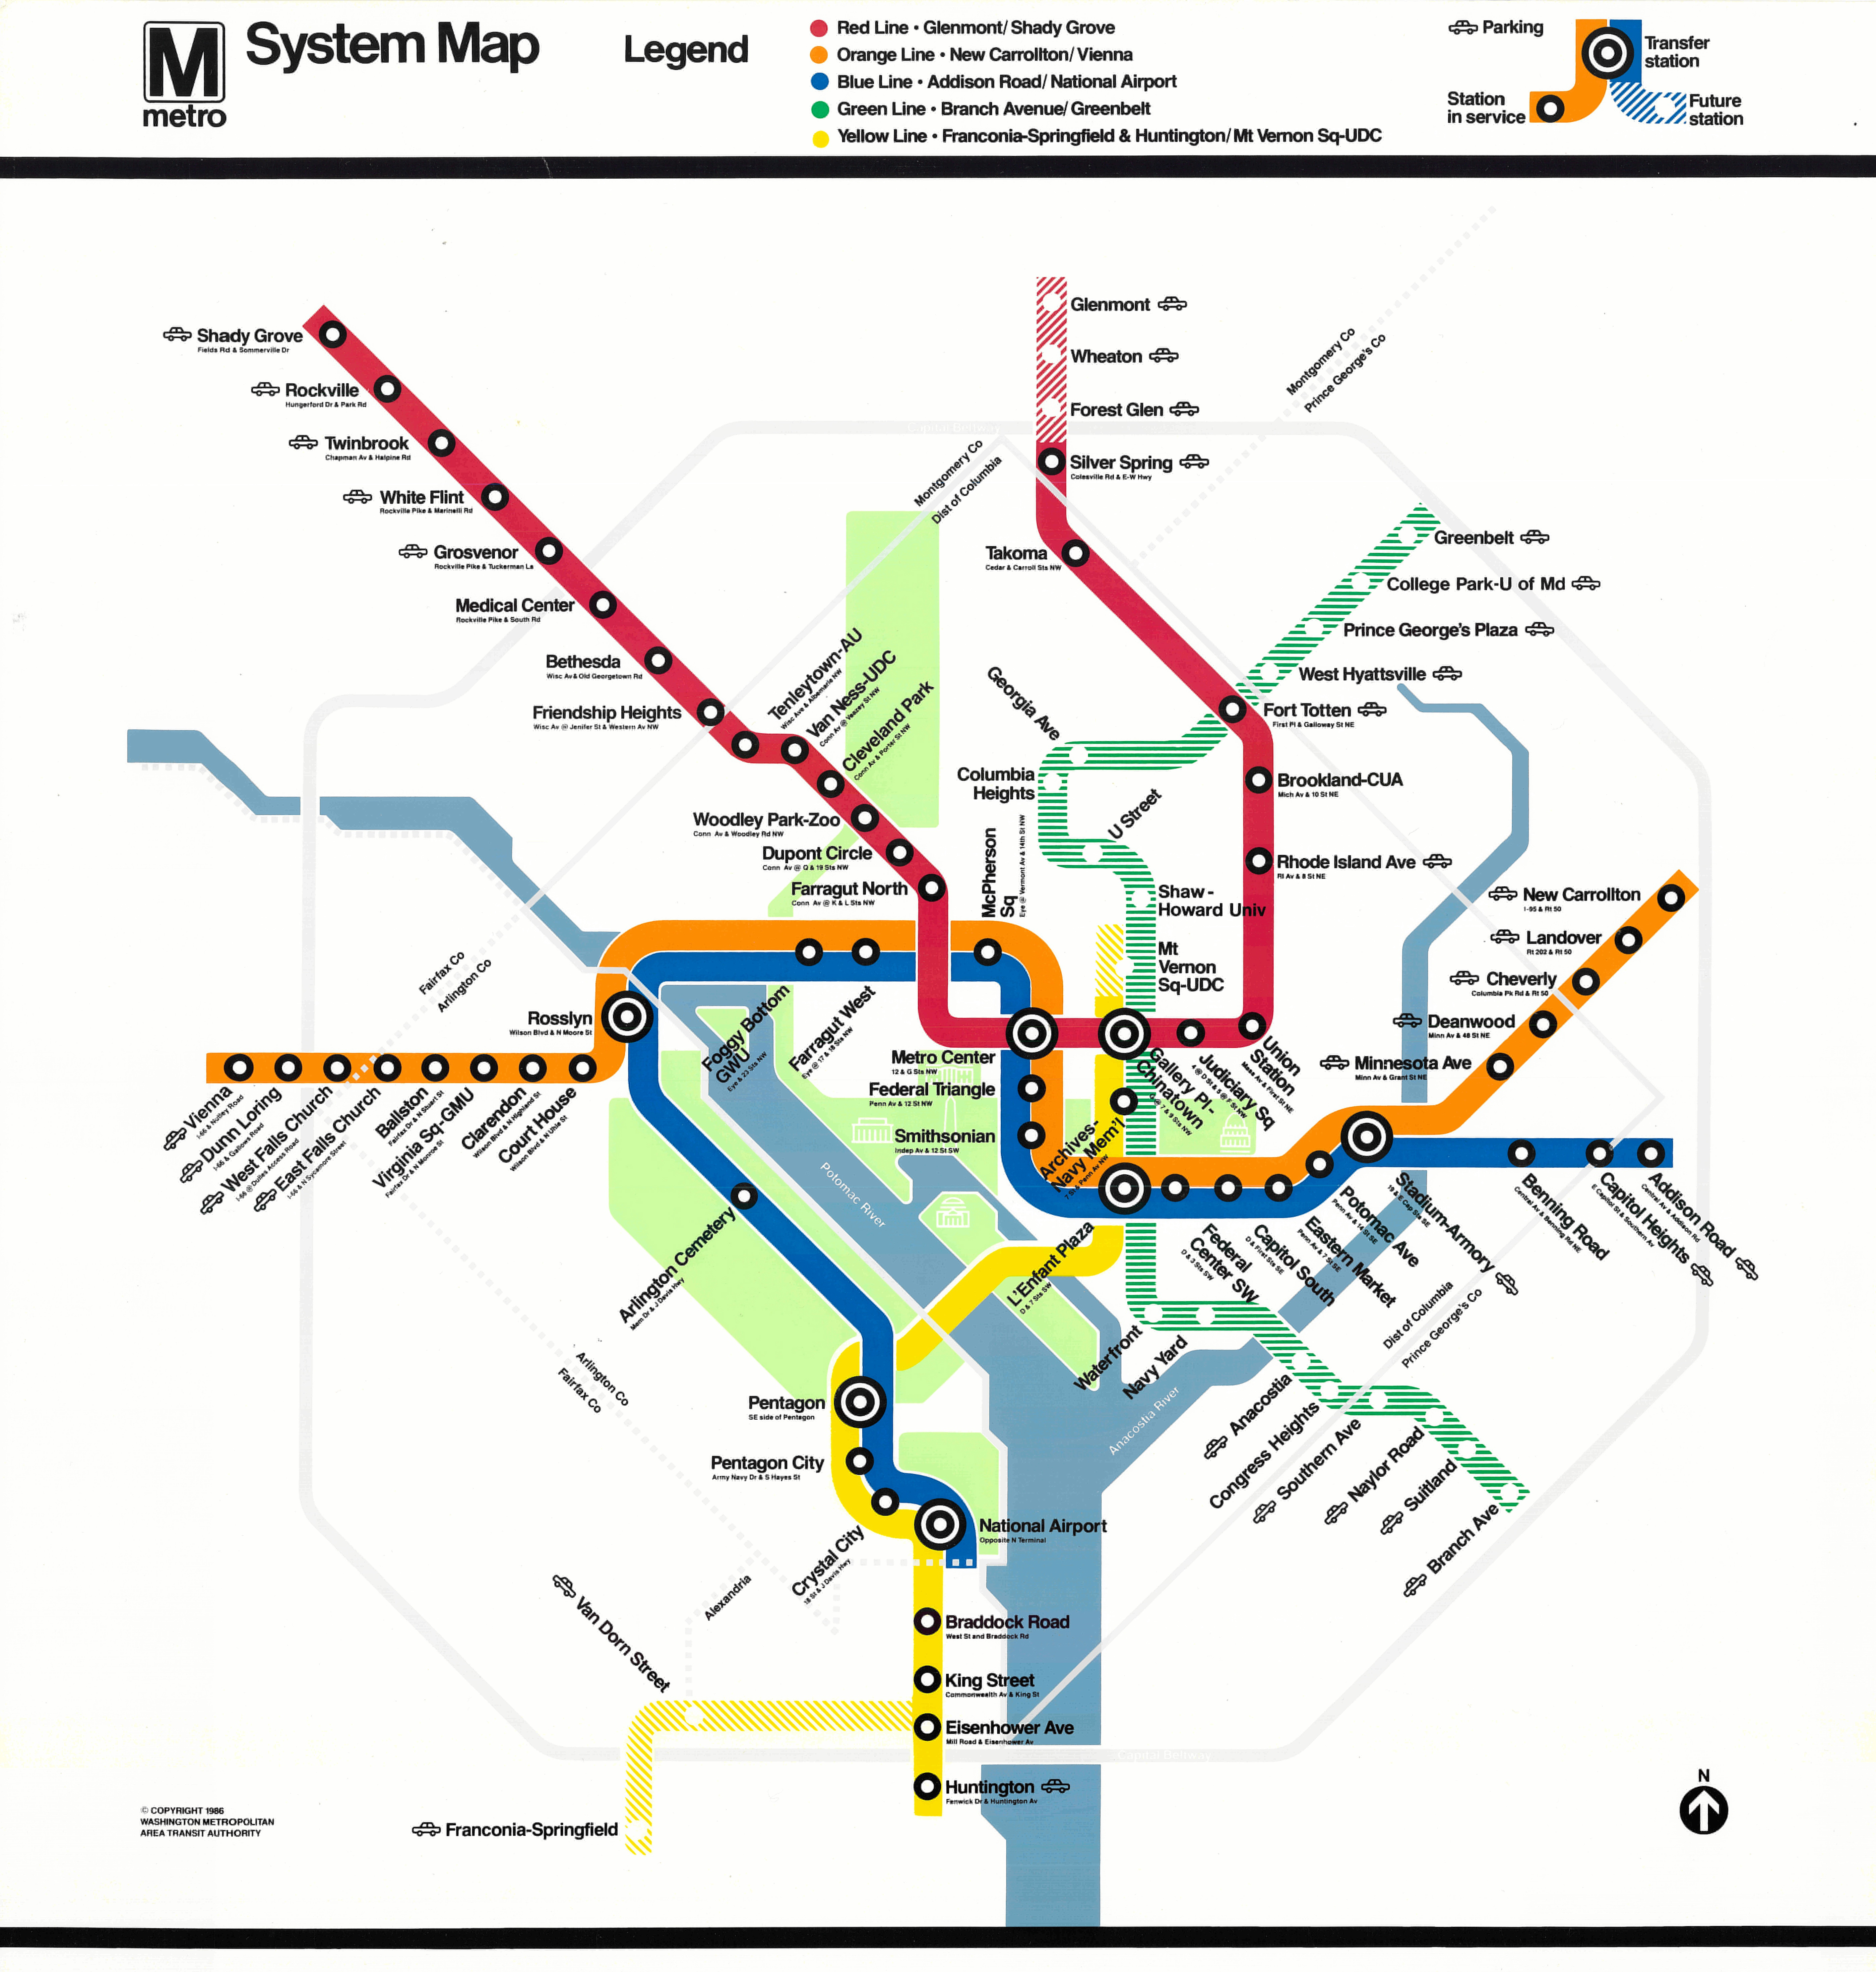
The System Map is designed using
a geometric / diagrammatic style to incorporate Washington’s geographic landscape with all major rivers, parks and landmarks including the Beltway and county borders of Maryland and Virginia.
All rail lines are color-coded to tie in with all other way-finding graphics in the system.
A Time / Fare panel lists all Metro stations and displays estimated travel times and required fares for each currently operating station in the system.
The map was designed on a grid to accommodate the future expansion of the Metro system by adding additional lines.
Retained in 1974 by the Washington Metropolitan Area Transit Authority (WMATA) to design and develop a Map program for the new subway system being constructed to serve Washington, DC and neighboring VA and MD.
To include a System map and related Neighborhood
maps for all stations in the system.
To include a System map and related Neighborhood
maps for all stations in the system.
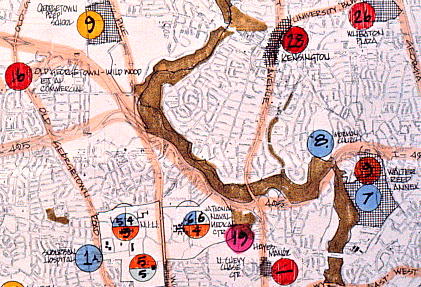
The original five Neighborhood Maps were designed to reflect the location of Metro rail service in that station area.
It provided patrons with information regarding Landmarks, Federal and Municipal buildings and other local features determined by WMATA.
Each map covers approximately 9 square miles. Station entry / exit points are included for each station.
Collecting data for each map and coordinating information with local jurisdictions was our responsibility.
A total of 33 Neighborhood Maps were completed between 1974 - 1991.
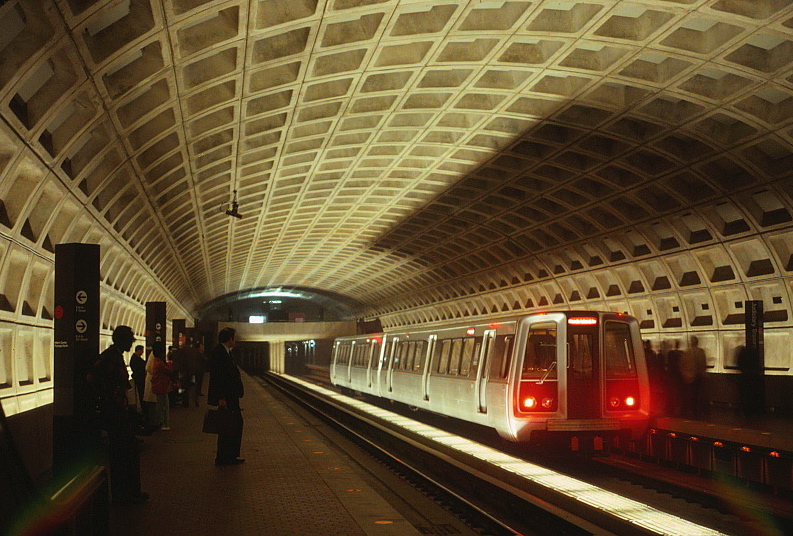
A typical below grade Metro Station at platform level.
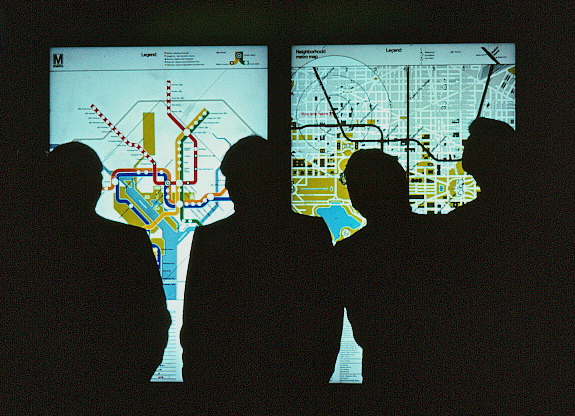
System and Neighborhood maps are displayed adjacent to one another in a 7’ x 5’ light box on the mezzanine level.
They are updated as the system expands.
They are updated as the system expands.
The System Map incorporates a geographic profile of the downtown Washington area showing Parks, Rivers and icons of Landmark buildings on the National Mall.
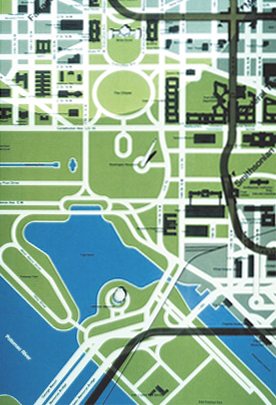
Each Neighborhood Map shows the actual path of each Metro line relative to the street grid and incorporates
significant Landmarks and Buildings.
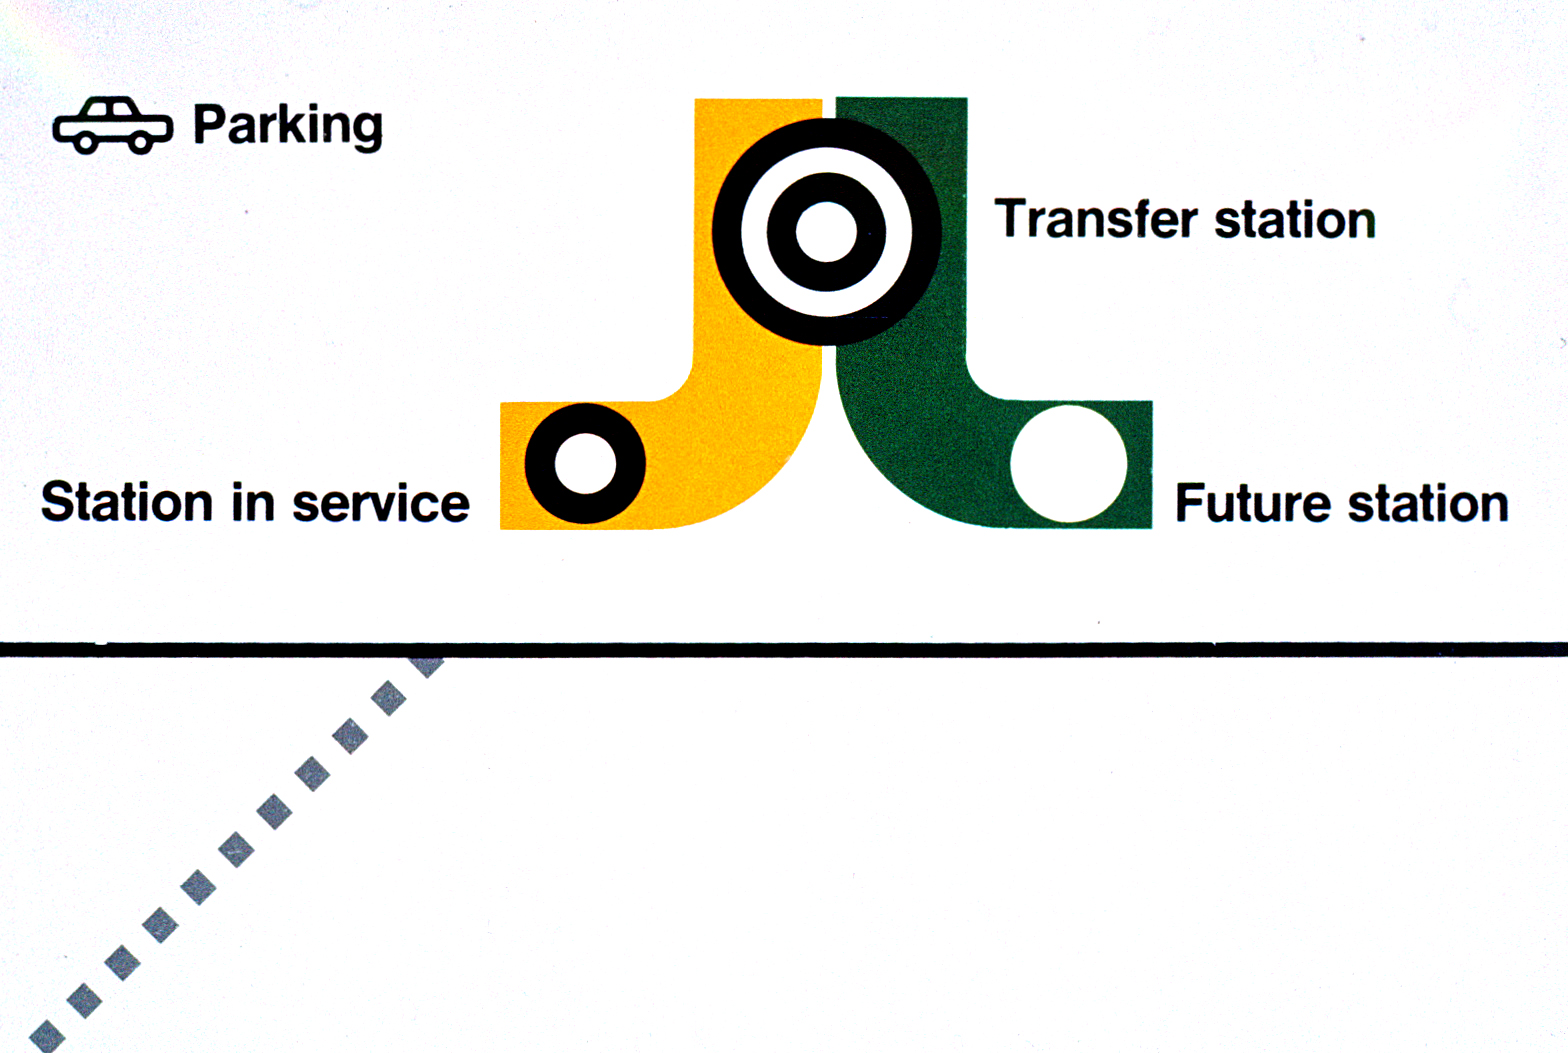
An additional graphic key defines transfer stations, open and future stations and which stations offer parking facilities. A Beltway indicator on the map also shows boundaries for MD and VA.
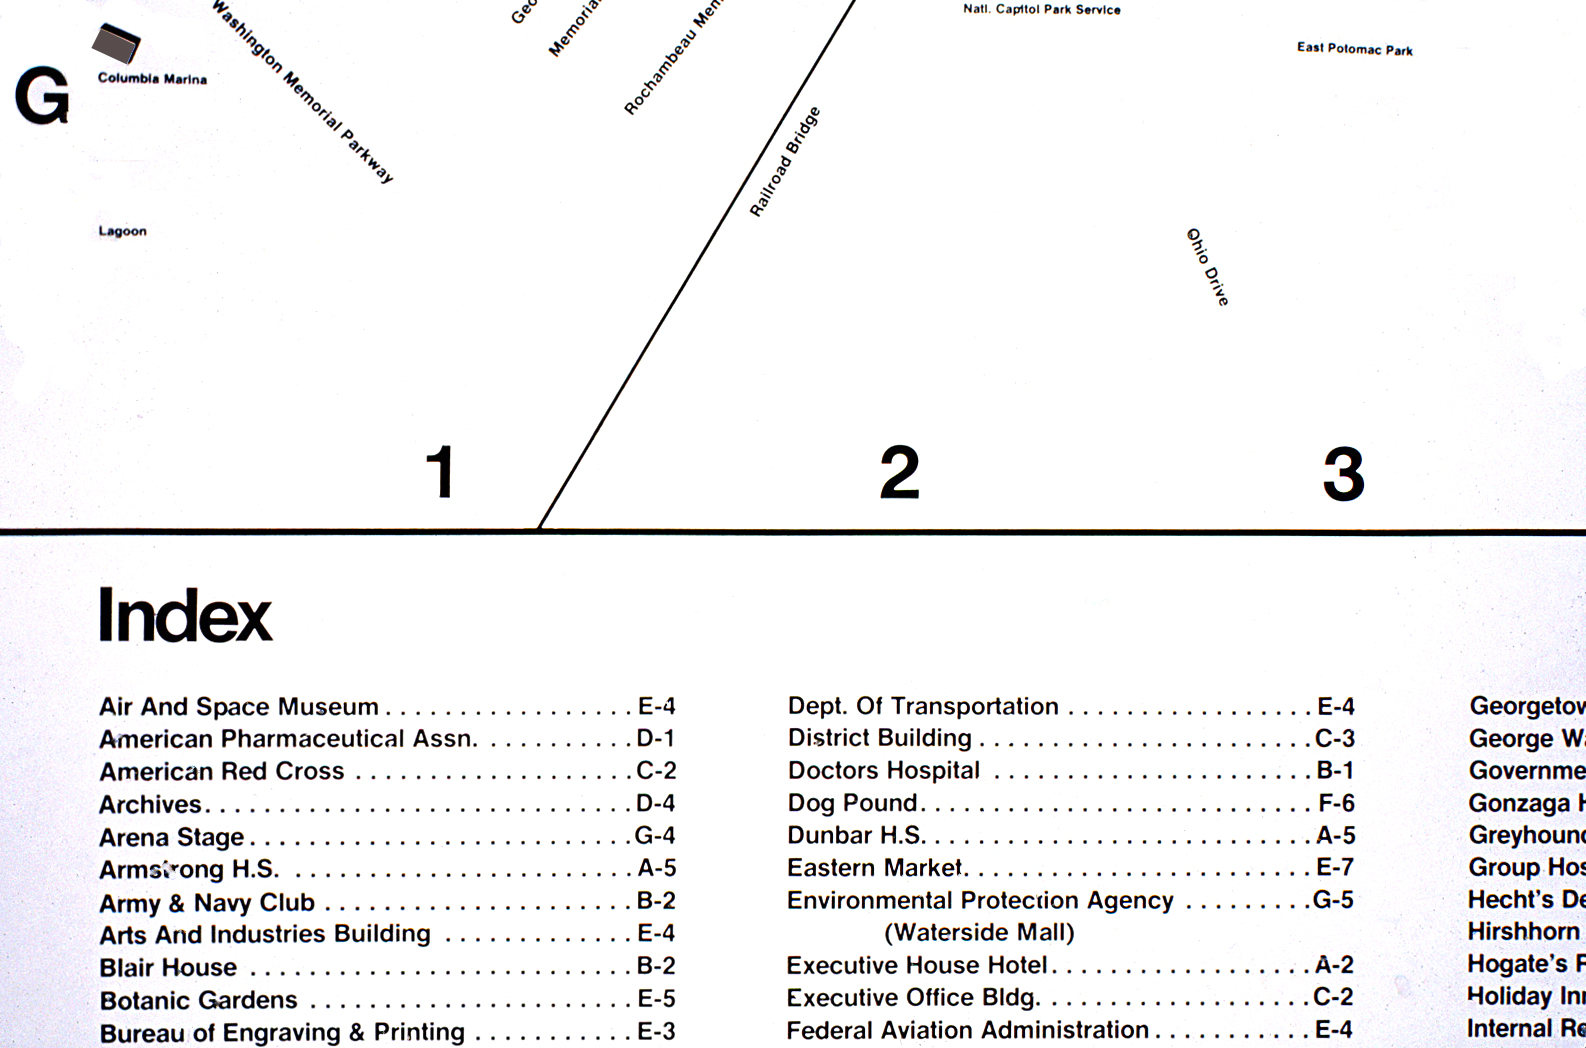
An alpha-numeric grid around the Neighborhood map provides coordinates for an alphabetical listing at the bottom of each map showing all data noted for that specific Neighborhood Map.
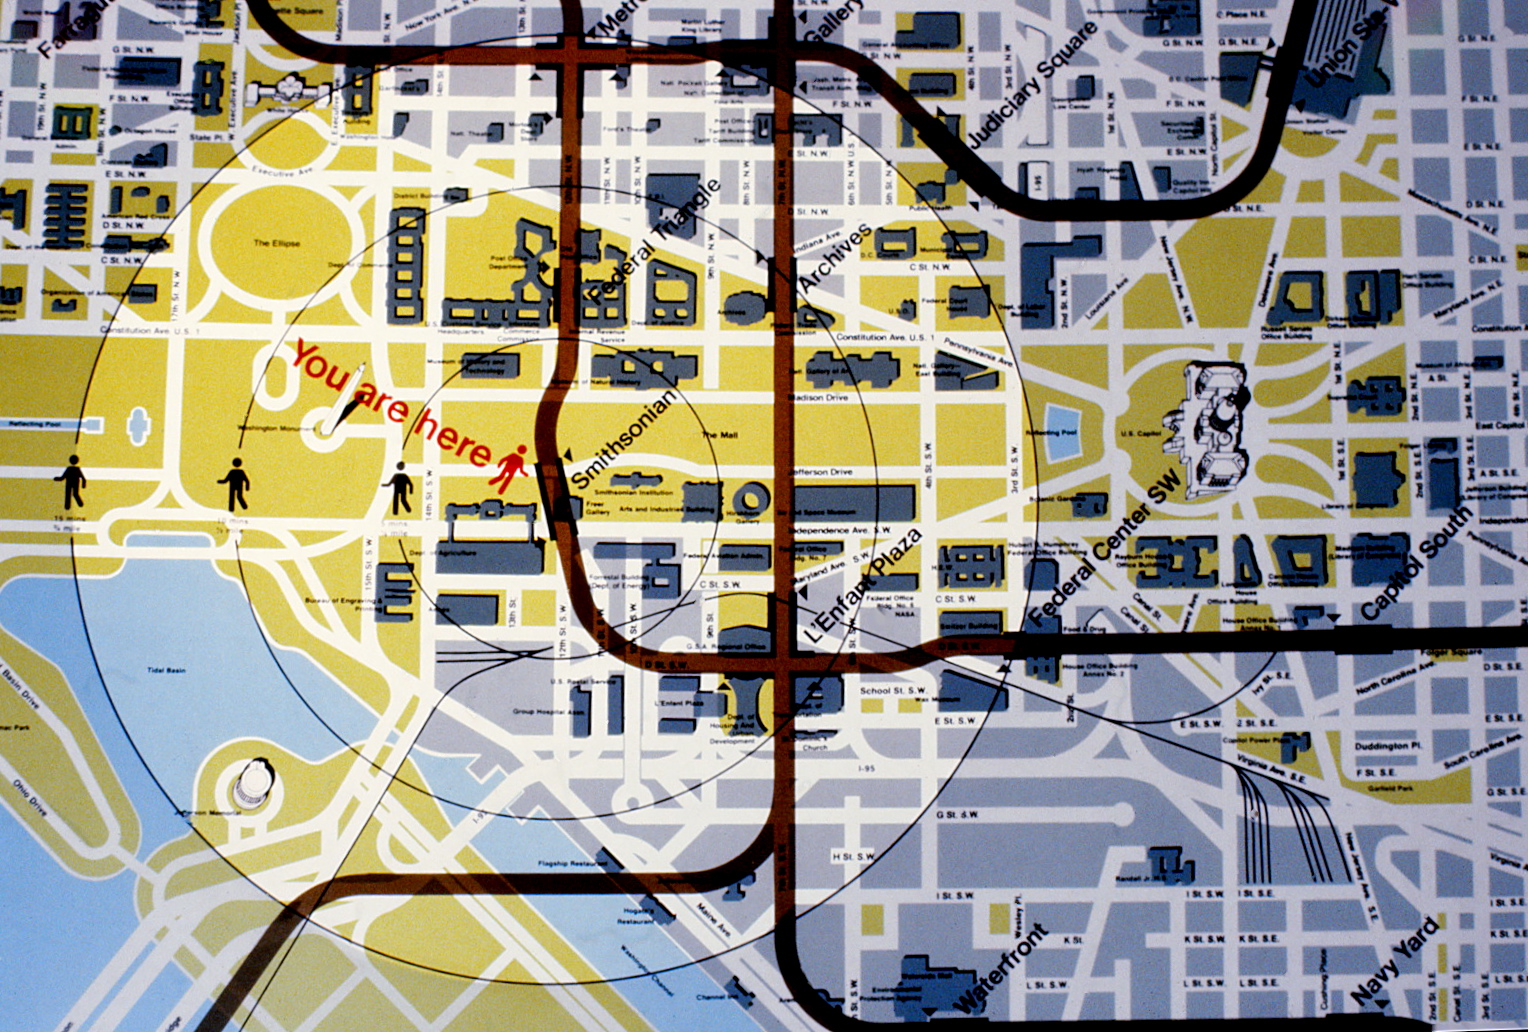
Each Neighborhood Map incorporates an overlay with a “you are here” figure including walking time and distances from that particular station to points of interest. A drop-out-circle highlights that area of the neighborhood.
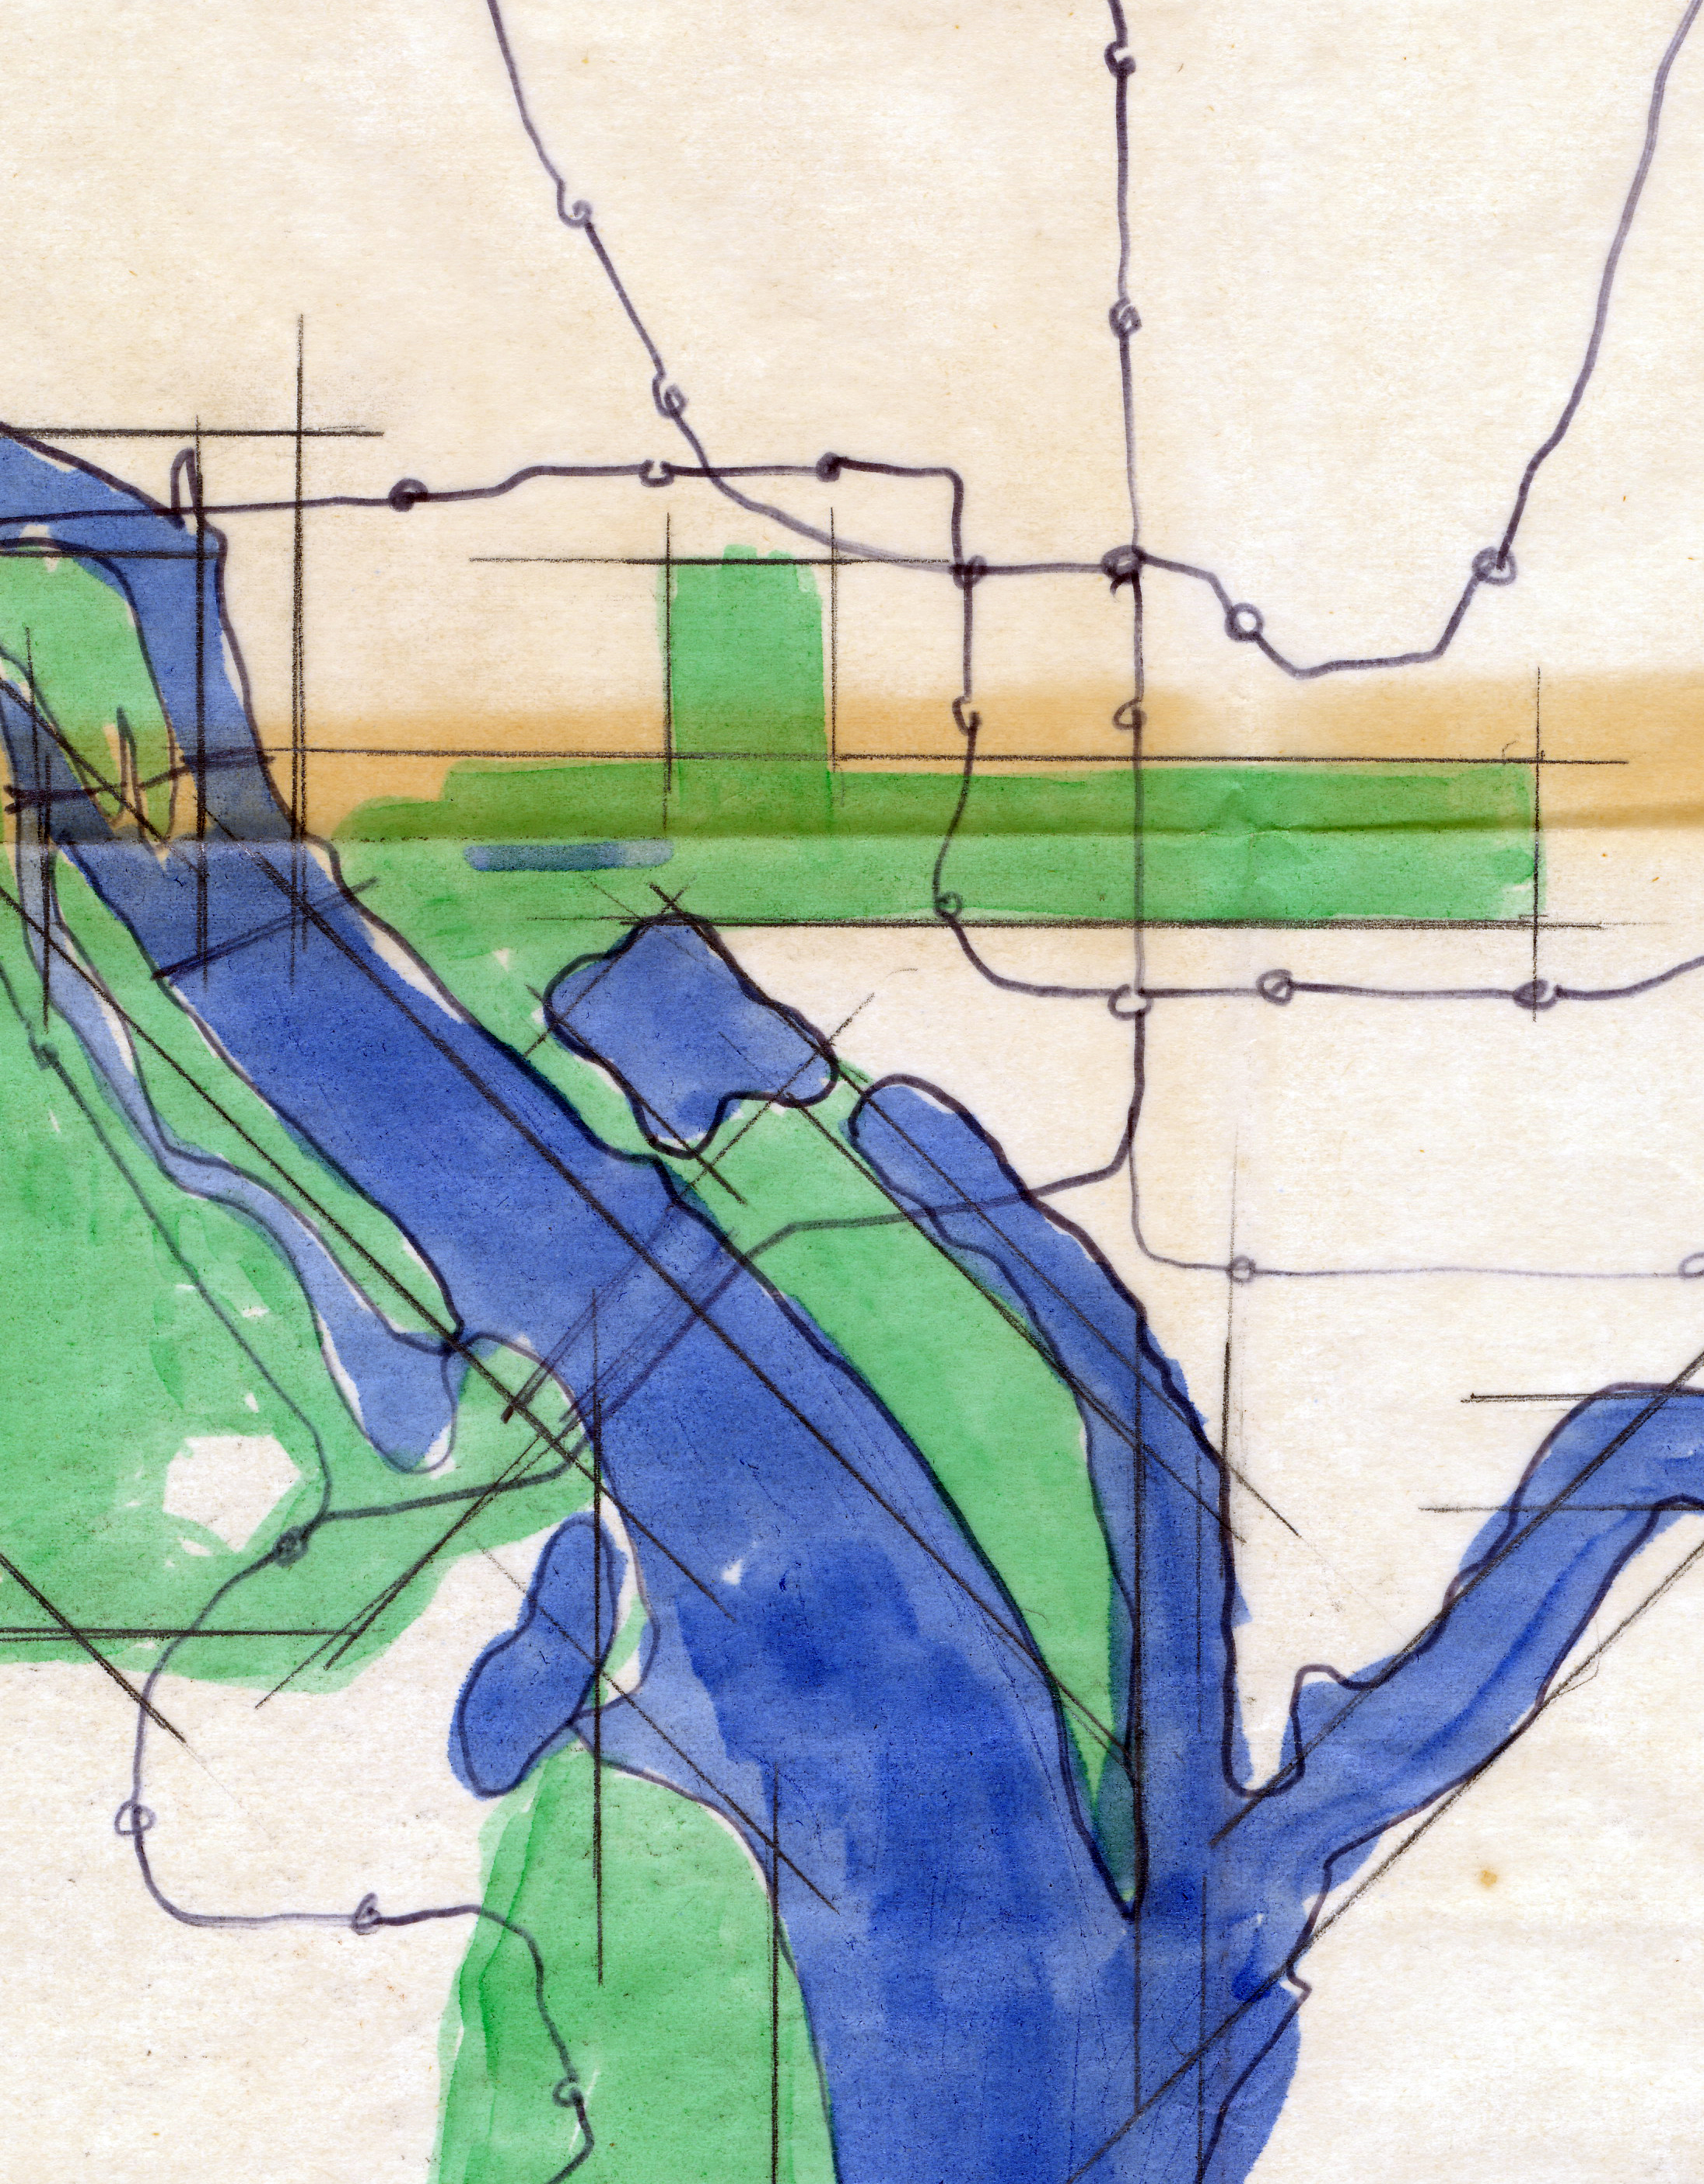
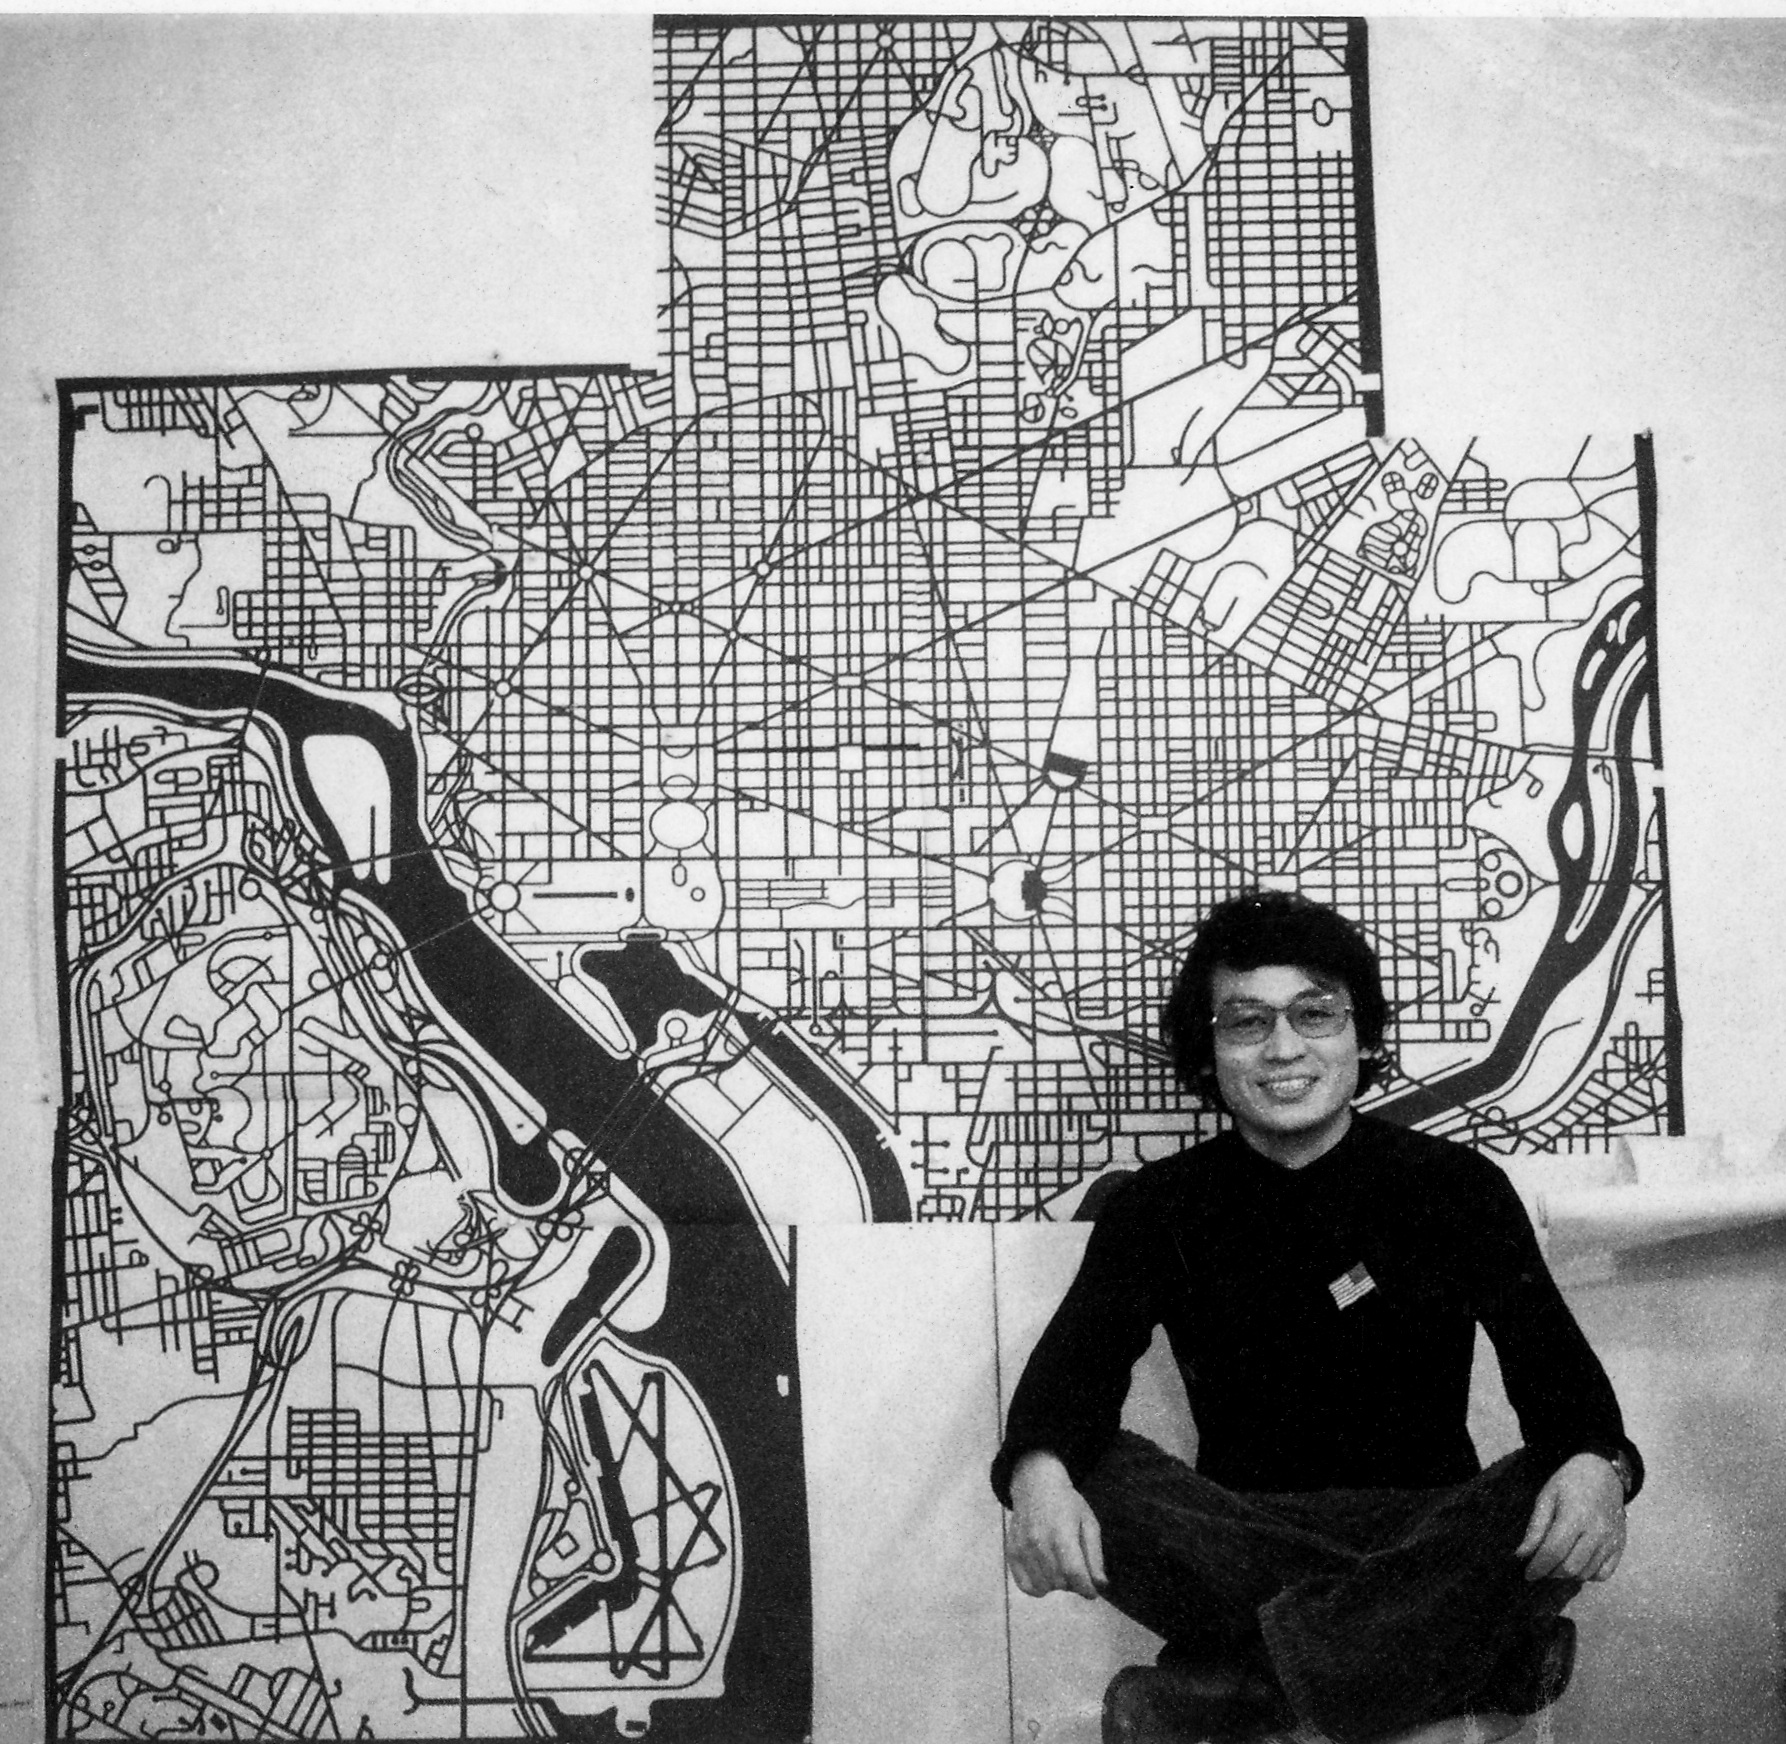
Early sketch for incorporating geographic information with a grid of the five rail lines.
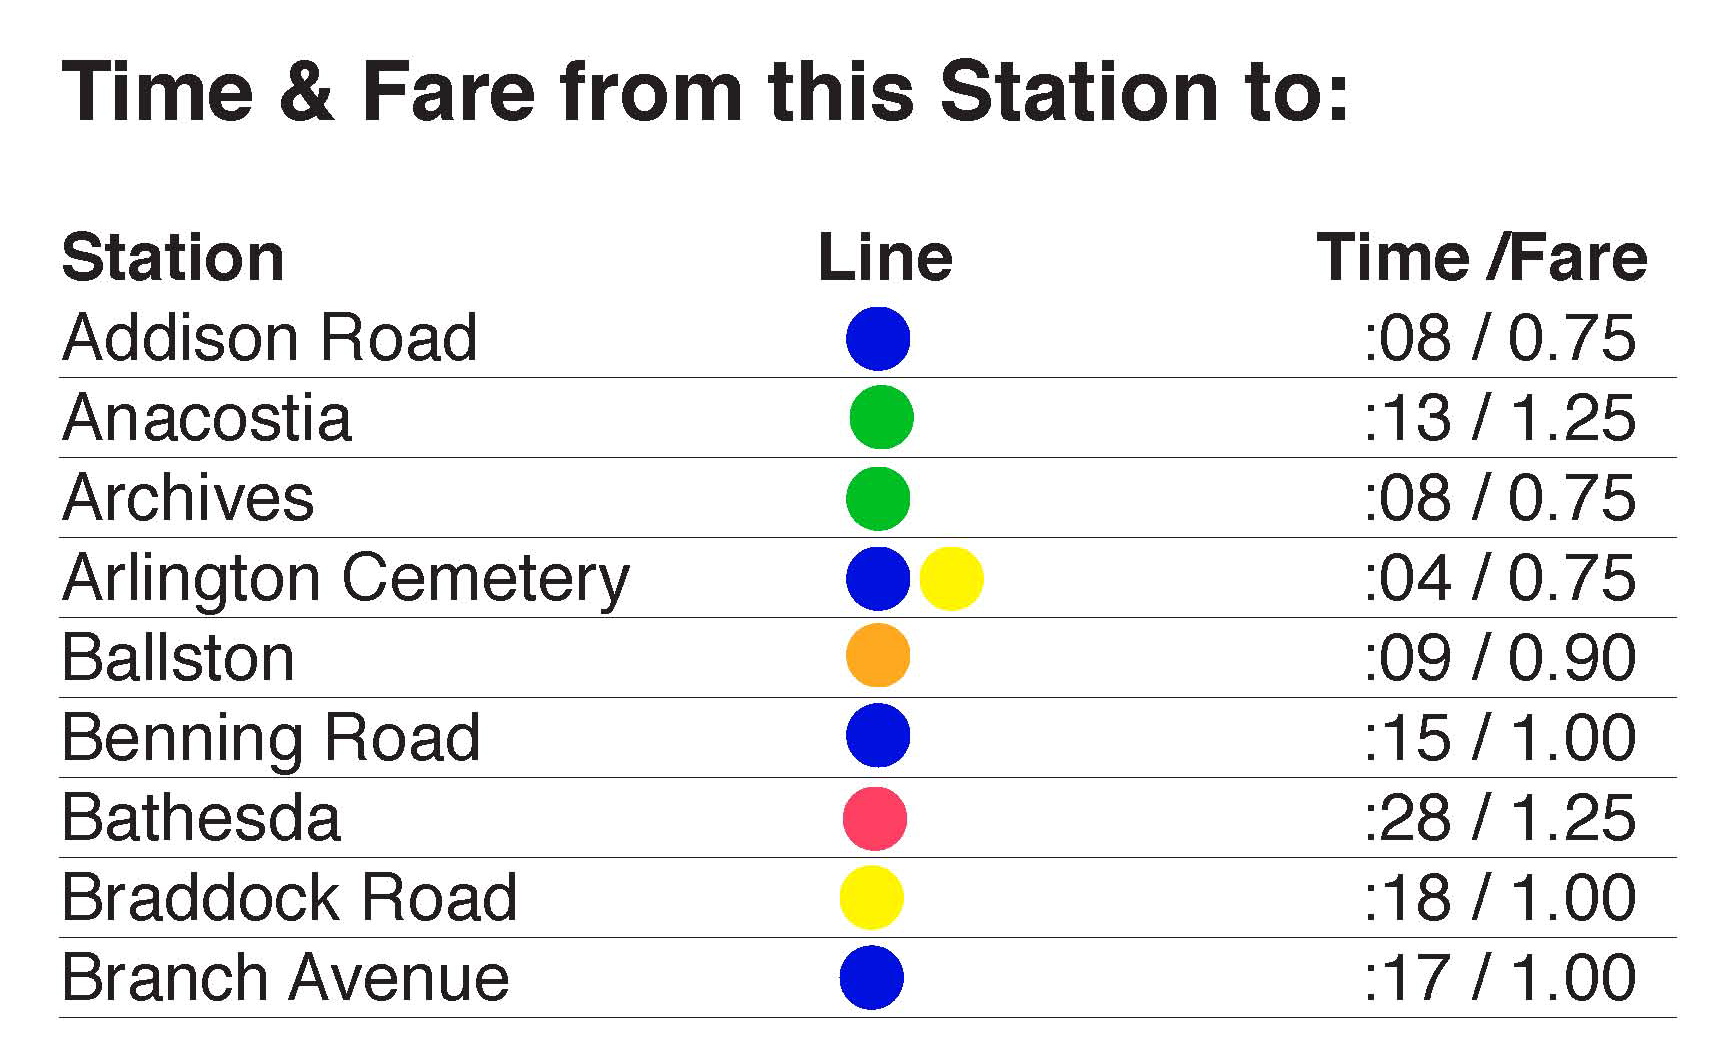
As they become operational, System Maps display Time and Fare information for each color coded station in the system.
Clear overlays are used to update information as it changes.
The System Map design had to retain its legibility in a variety of formats ranging from a 36” x 48” Mezzanine Map (backlit), to a 18” x 18” Train Map and a 6” x 6” Opening Day handout.
THE TRAIN MAP
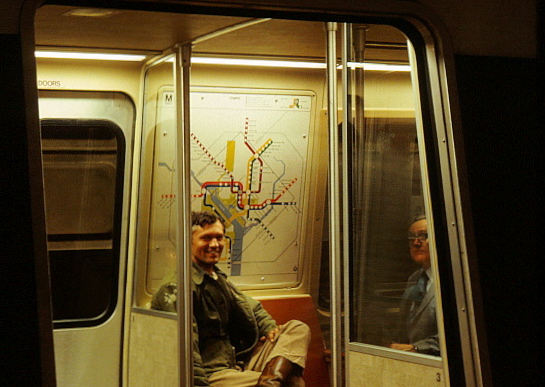
A smaller scale version of the System Map is displayed in all rail cars as an onboard Train Map.
It is also incorporated in Emergency Exit panels with all emergency instructions and procedures.
It is also incorporated in Emergency Exit panels with all emergency instructions and procedures.
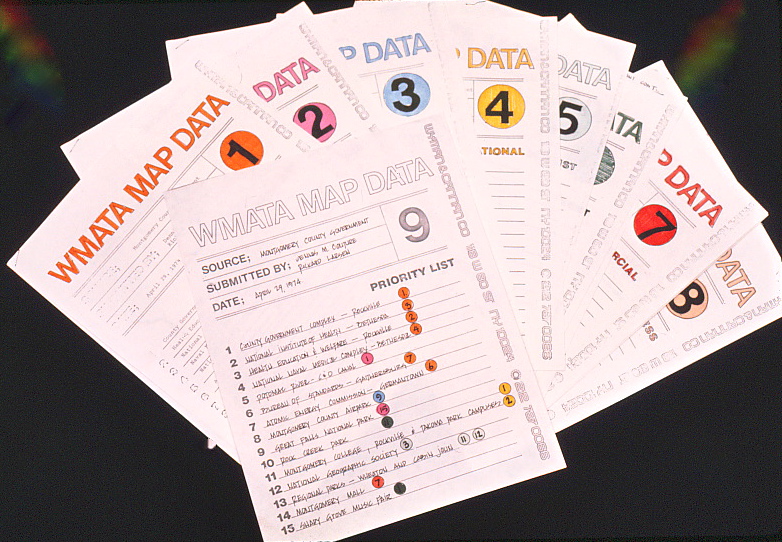
RESEARCH
Prior to designing the 3 mile square Neighborhood Map, each jurisdiction was asked to submit prioritized data regarding Government buildings, other important buildings, public parks, recreation areas, shopping and retail areas plus bus and rail information including verification of streets and names. This data was then compiled to create the individual map serving that particular Metro Station. Initial map layouts were then re-submitted for jurisdiction approval.
Collected data from each Research Form was then noted on local tax maps.
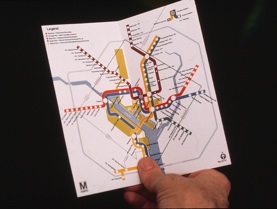
The initial handout map showing the first 6 operating stations in the system and it’s eventual network.
NEIGHBORHOOD MAP PRODUCTION
A standard Neighborhood Map format was established for all future maps. Over the time span needed to create 33 new Neighborhood Maps, we transitioned to the use of electronic media for generating production art for all future map iterations for Metro.
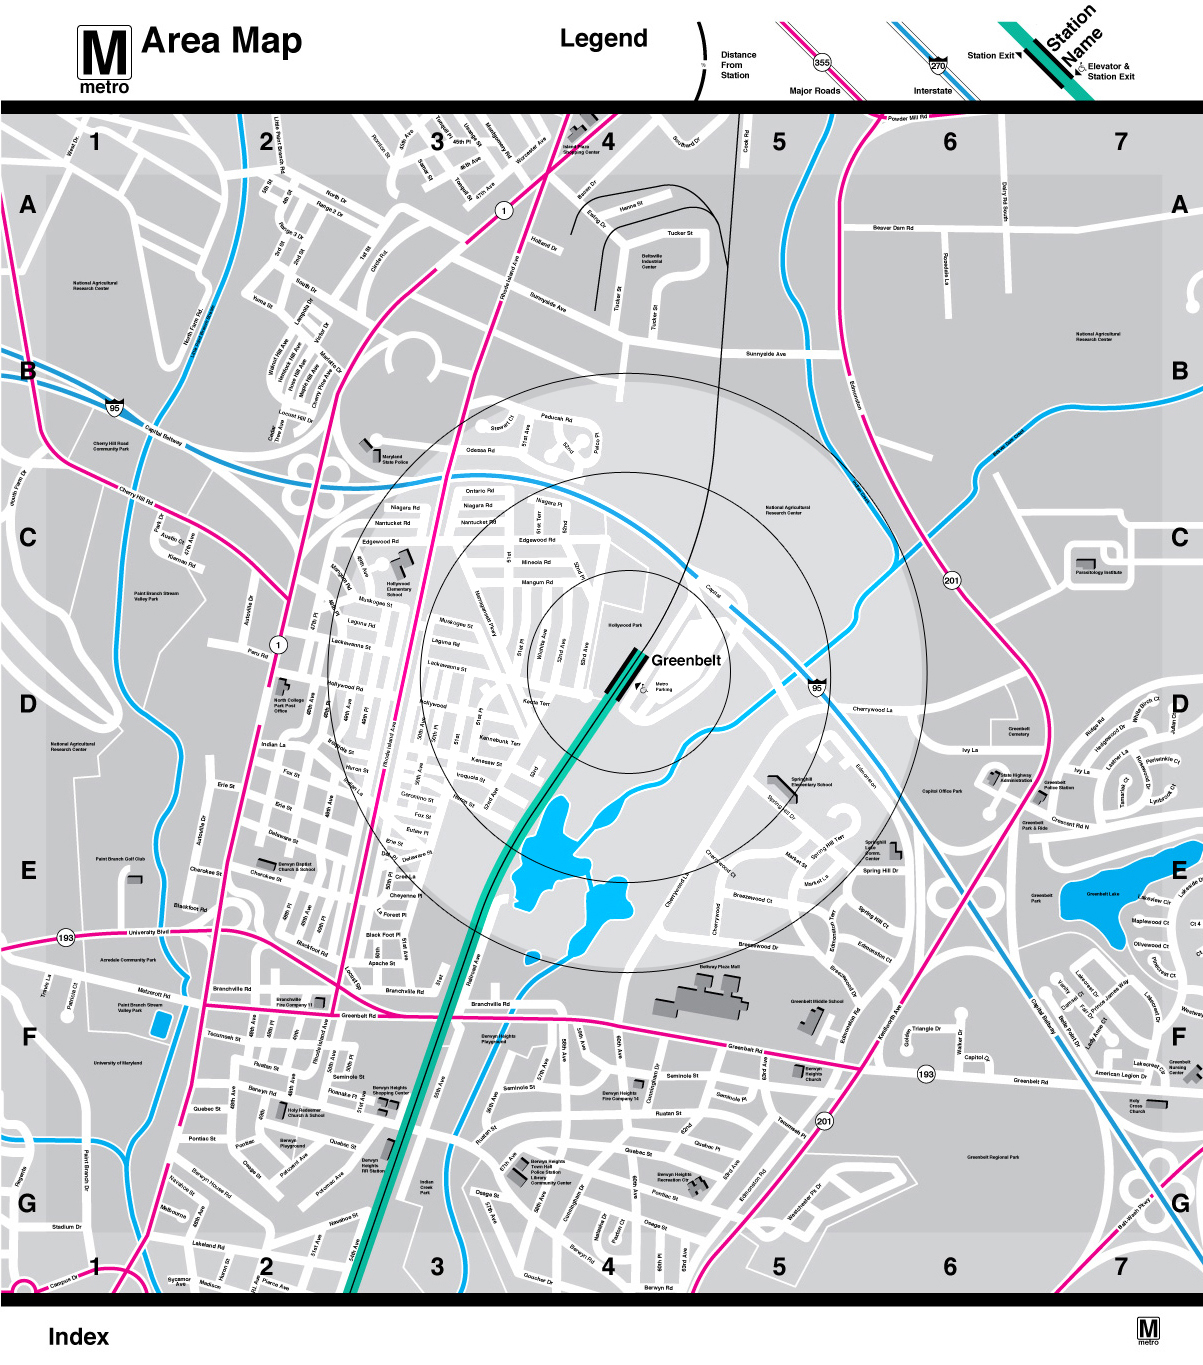
The 1992 Greenbelt, MD map is shown below.
The 1992 Greenbelt, MD map is shown below.
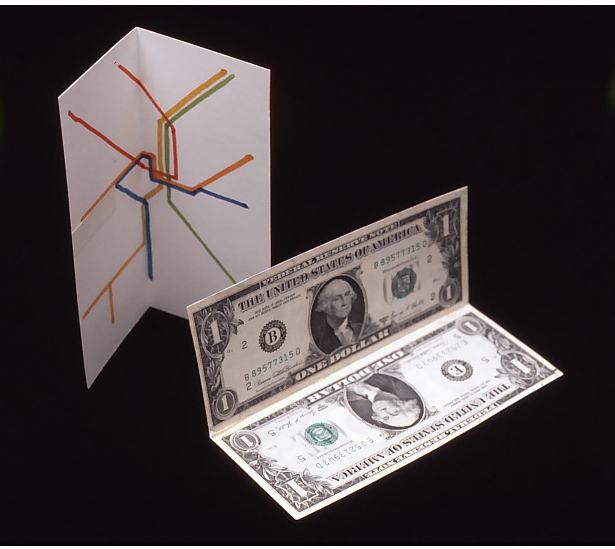
A concept mock-up showing a pocket sized dollar bill format would accommodate the System Map and retain it’s legibility.
BASE MAPS
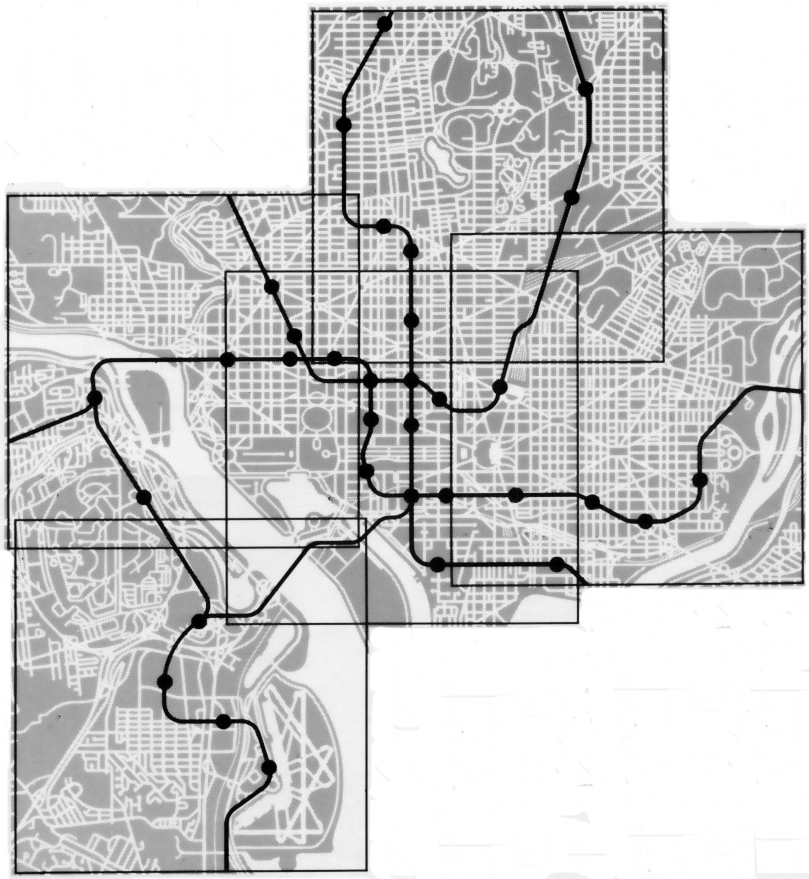
The five original neighborhood maps.
This composite shows the relationship of actual rail lines to the network covered by the Neighborhood Maps.
The first generation of Neighborhood Maps were hand-cut in Rubylith, the standard masking material used at that time for creating film separations for silk screen production.
The advent of computers drastically changed the design and production of all future Metro maps.
The advent of computers drastically changed the design and production of all future Metro maps.
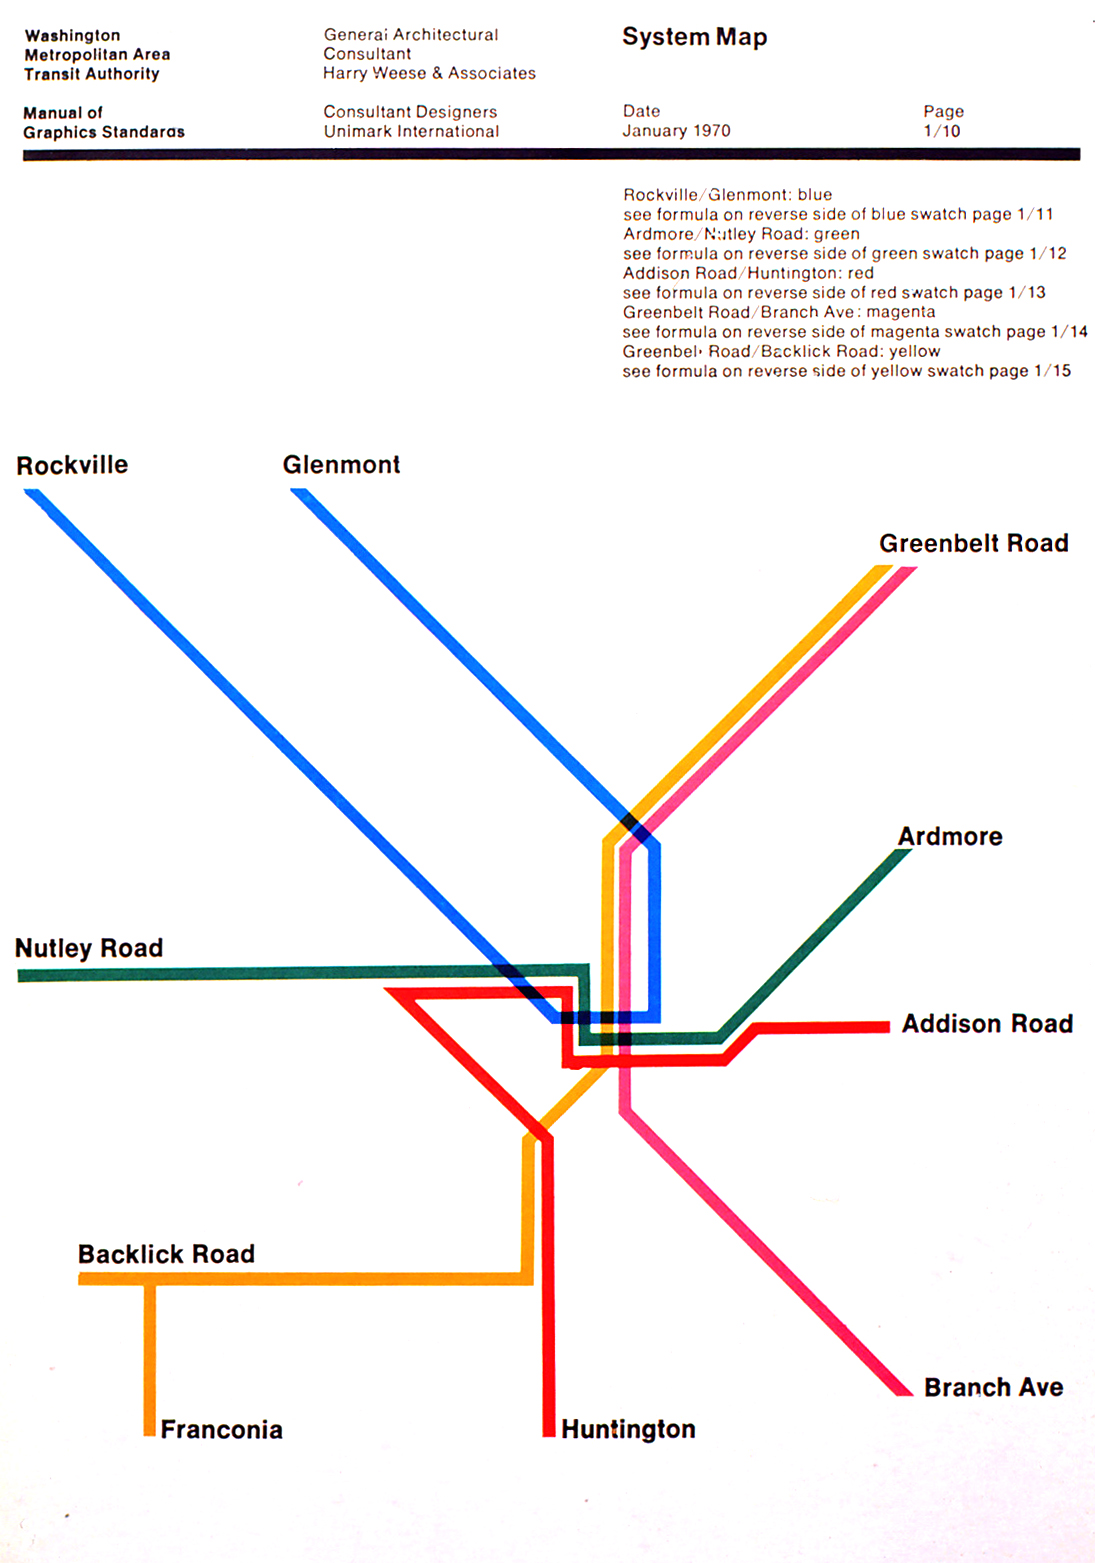
A page from Metro’s Graphic Standards Manual showing Massimo Vignelli’s initial diagram for a System Map.
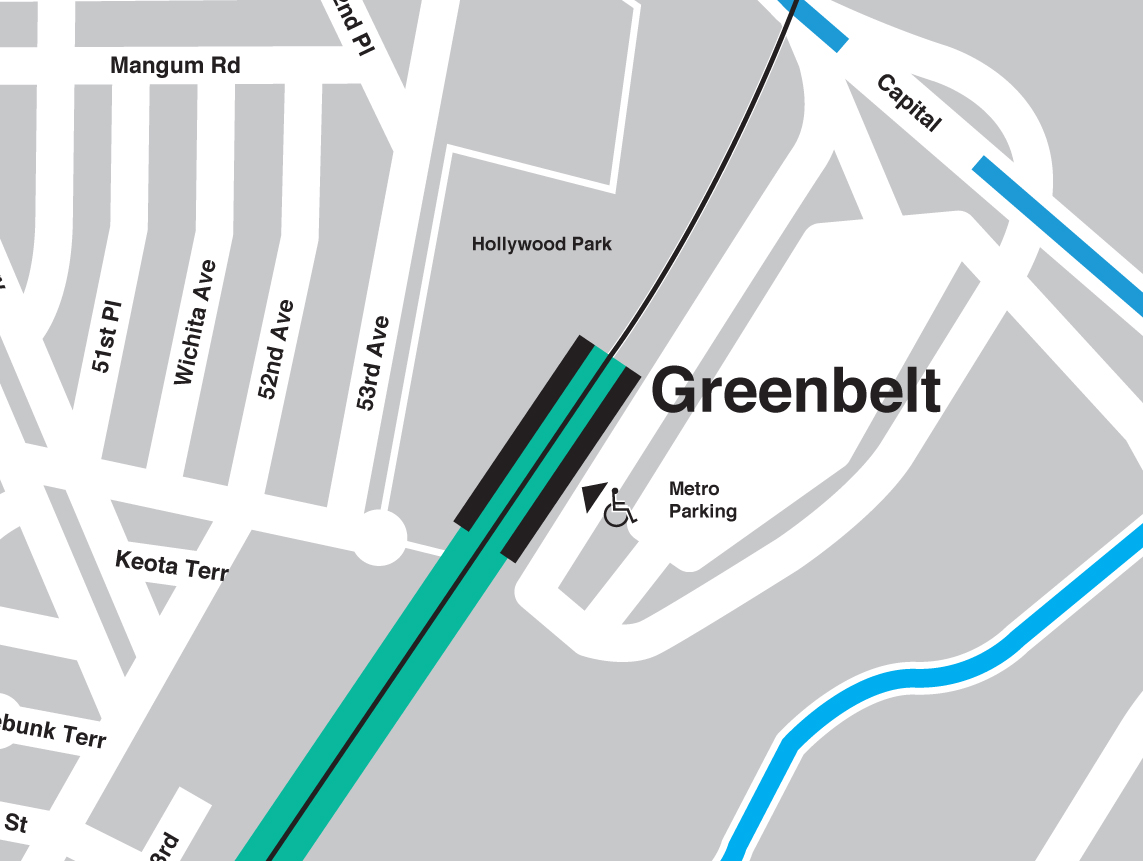
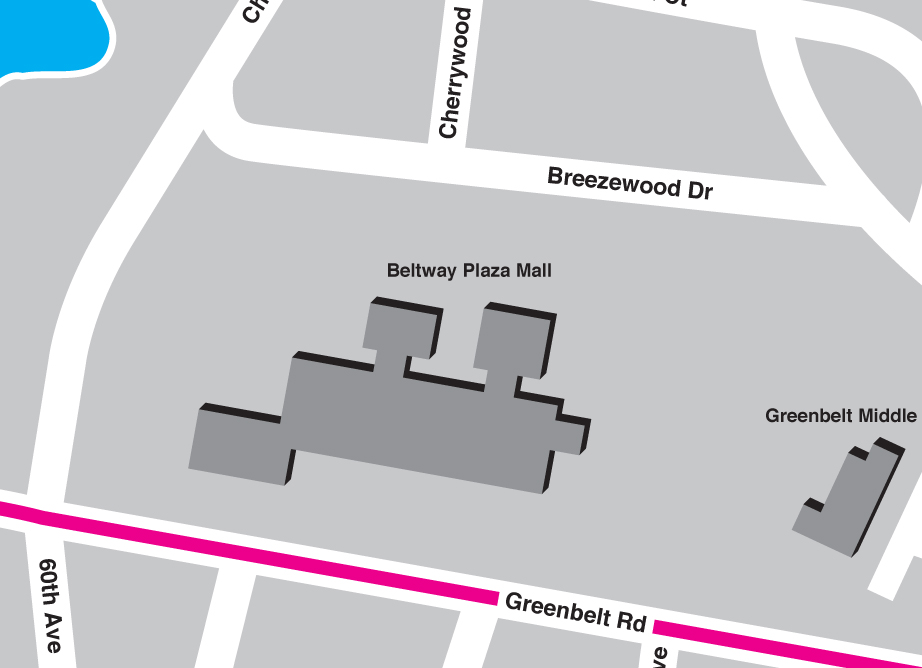
Detail showing the Station relative to streets and parking, including handicapped entries.
All building profiles include cast shadows to improve legibility.